Environment
Response to Climate Change

Policy
Policy on climate change
Policy on greenhouse gas reduction
Climate change is primarily caused by the increase in greenhouse gas emissions resulting from fossil fuel consumption. Its negative impacts are already evident in the growing frequency of natural disasters such as heavy rainfall and flooding, the depletion of food and water resources, extreme heat, and the spread of infectious diseases. This poses significant threats to our lives and ecosystems.
NOF supports the goals of the Paris Agreement to keep the rise in the global average temperature well below 2°C above pre-industrial levels (the “2°C target”), and pursuing efforts to limit the increase to 1.5°C wherever possible.
To help mitigate climate change and realize a decarbonized society, we aim to achieve carbon neutrality by 2050. As an interim target for greenhouse gas (GHG) emission reductions, we have set a goal of reducing emissions by 40% or more by fiscal 2030 compared with fiscal 2013 levels, and we are actively working to reduce GHG emissions.
Our focus goes beyond reducing our own GHG emissions to encompass our supply chain, as we contribute to climate change mitigation through raw material procurement, efficient delivery, and the provision of environmentally friendly products and services. We are determined to take action and grow with society for a sustainable future.
GHG reduction strategy
We have established and disclosed our Management Policy Regarding Responsible Care as well as CSR Procurement Policy, declaring our commitment to GHG reduction measures across the entire supply chain.
To implement these policies, we have set Responsible Care guidelines within the Group that address climate change mitigation and adaptation, biodiversity, resource recycling, research and development, and manufacturing.
At our production sites, we are promoting the shift to lower-impact energy sources for Scope 1, improving energy efficiency for both Scope 1 and Scope 2, and responding in line with each category of Scope 3. We are also working on research and development for environment-related product lines that contribute to climate change mitigation and adaptation.
For externally procured raw materials, we have established our CSR Procurement Guidelines to promote the procurement of materials with low environmental impact. To this end, we work to raise supplier awareness, participate in the Declaration of Partnership Building with suppliers to put these principles into practice, and advance sustainable procurement activities.
Furthermore, as part of the Japan Chemical Industry Association’s Responsible Care initiatives, we actively participate in dialogue with suppliers and local communities.
Moreover, we are pursuing decarbonization innovations throughout the supply chain. This includes industry-academia collaborative projects focused on the research and development of biomass-derived materials and the effective utilization of unused exhaust heat.
Through these initiatives, we are reducing GHG emissions under Scope 3 and enhancing the overall sustainability of our entire supply chain.
Activities through industry associations
With an eye to achieving carbon neutrality by 2050 and driving social transformation, NOF is taking on the challenge of green transformation (GX) and has joined the “GX League,” in which companies pursuing sustainable growth in present and future society collaborate with corporations, government, and academia engaging in similar initiatives. In addition, we are members of many industry associations, including the Japan Chemical Industry Association (JCIA), where our President and Chief Executive Officer serves as a director. We actively incorporate and leverage in our daily activities the policies and latest developments discussed in these associations regarding climate change solutions. In addition, while working on the goals of each association, we ensure alignment so that these goals are consistent with NOF’s own policies and strategies.
Furthermore, in the Japan Soap and Detergent Association (JSDA), of which we are also a member, our President and Chief Executive Officer serves as a director and periodically assumes the role of chair of the Environmental Committee, striving to address industry-wide environmental issues.
Roadmap
Roadmap toward reducing greenhouse gas emissions
The Domestic Group has created a roadmap toward reducing greenhouse gas emissions and is working to mitigate climate change in its business activities. Considering the possibility of an increase in emissions due to business expansion, the Group will aim to become carbon neutral in 2050 by introducing renewable energy as the new Phase 2 and starting to consider new processes and technologies as Phase 3, while also reducing the financial burden associated with transition risks.
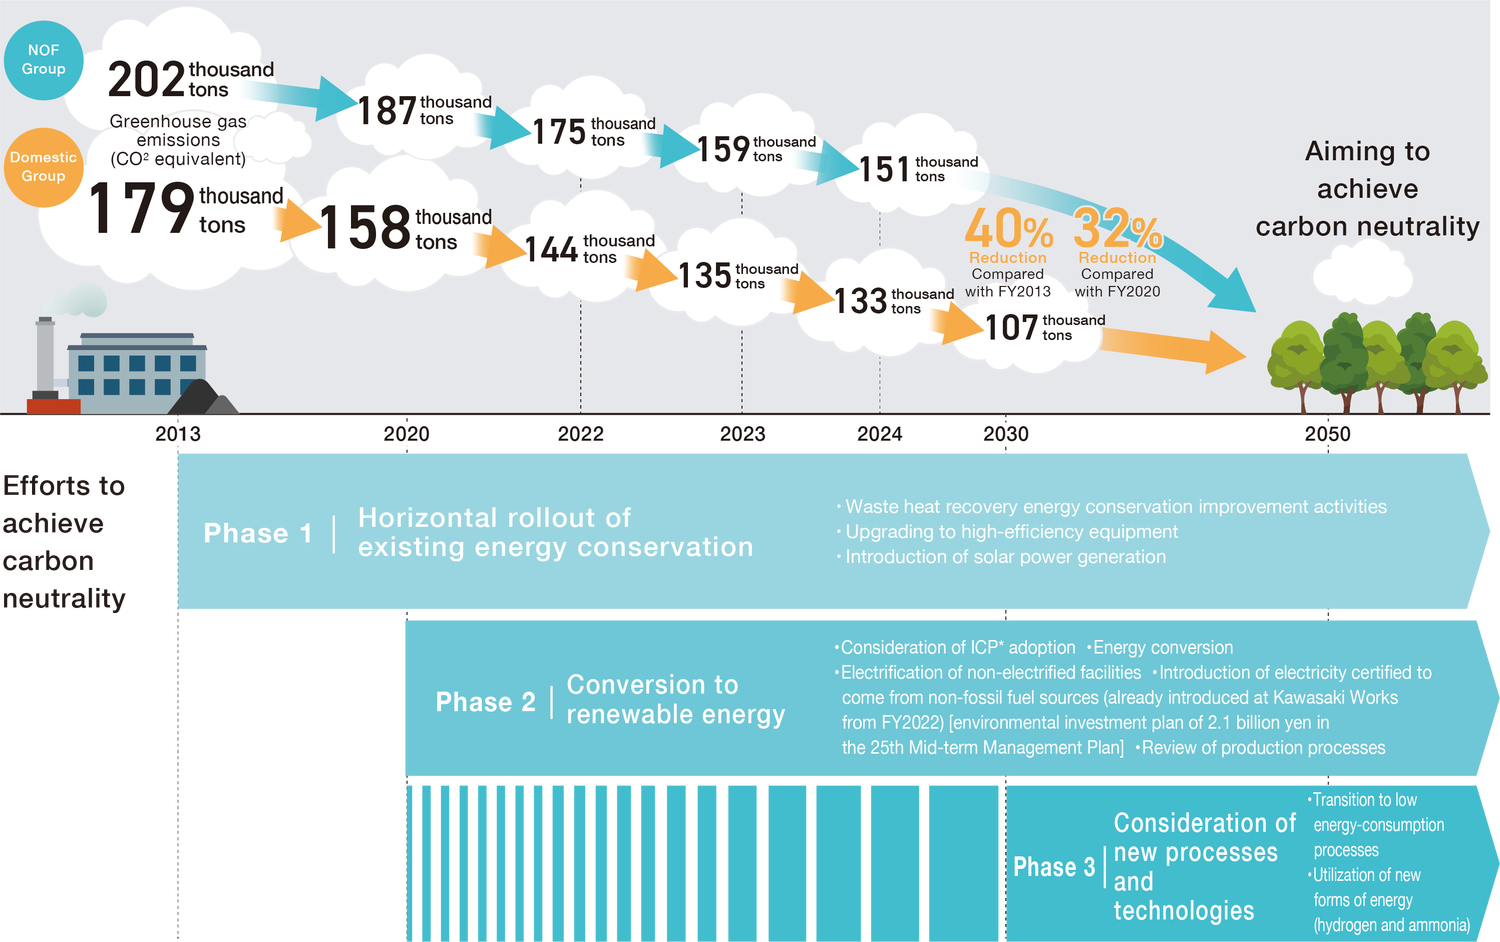
Reduction of GHG (CO₂ equivalent) generated by our business activities [Scope 1, 2]
[Covered organizations:NOF Group / Domestic Group]
Progress and Results for Climate Change
Measures to meet greenhouse gas emission reduction targets
The NOF Group has set a mid-term target of reducing greenhouse gas emissions by 40% from the fiscal 2013 level by fiscal 2030, and a long-term target of becoming carbon neutral by 2050. The 2025 Mid-term Management Plan period is positioned as a period for building up reduction measures to be implemented in the next Mid-term Management Plan period, and we will promote reductions while controlling the increase in emissions associated with the expansion of production facilities.
As a specific measure, in order to increase the use of renewable energy, we will promote the electrification of our facilities and reduce carbon emissions. Furthermore, we are reviewing our production processes and considering improvement measures to minimize environmental impact, such as reducing the amount of energy used, minimizing emissions, and utilizing renewable energy sources. We also plan to expand fuel conversion and the introduction of electricity certified to come from non-fossil fuel sources. During the 2025 Mid-term Management Plan period, we are planning a 2.1 billion yen environmental investment for these initiatives.
Moreover, in order to promote the conversion to renewable energy and decarbonization even more, we are further expanding our trial initiative for internal carbon pricing (ICP). This initiative not only helps refine the economic assessments of facility investments and business strategies, but also raises employees’ awareness of energy conservation and serves as a mechanism to promote decarbonization across all business activities.
We are also advancing greenhouse gas reduction efforts through forest maintenance activities. By utilizing the Fukushima Prefecture Carbon Dioxide Absorption by Forest Maintenance Activities Certification System, we have carried out tree planting and thinning, and received certification for absorbing 282 tons of carbon dioxide from 2012 to 2013.
We will contribute to the mitigation of global warming by taking proactive steps to realize a sustainable future.
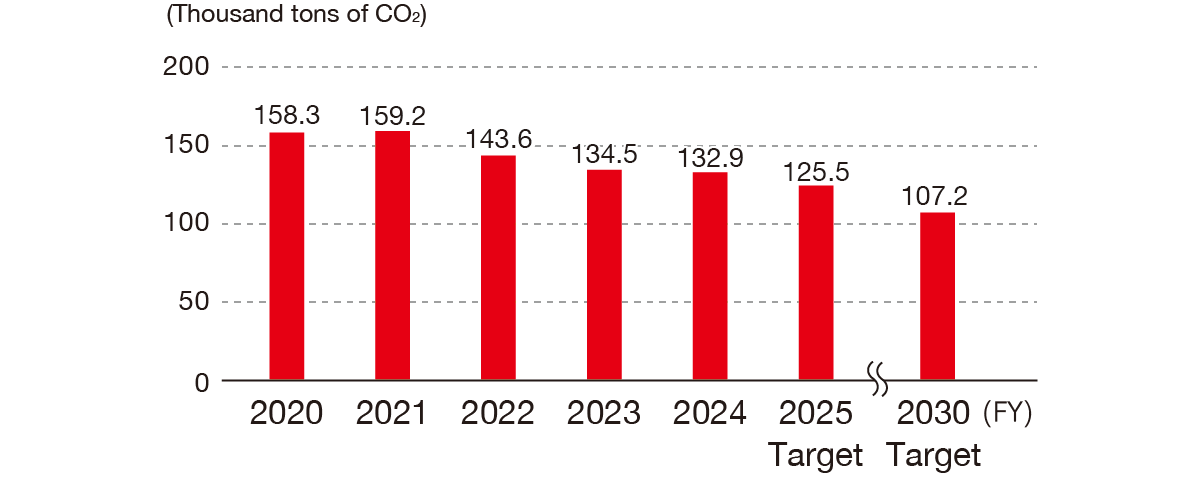
Greenhouse gas emissions
[Covered organizations:Domestic Group]
GHG reduction measures, including for Scope 3
The NOF Group is working to reduce greenhouse gas emissions across the entire supply chain in line with our CSR guidelines. We participate in the Declaration of Partnership Building, strengthening collaboration with our suppliers. We are also introducing systems and creating frameworks to enable proper evaluation of Scope 3 greenhouse gas emissions.
Scope 1 and 2 CO₂ emissions[Covered organizations:NOF Group / Domestic Group](Thousand tons of CO₂)
| FY2013 | FY2022 | FY2023 | FY2024 | FY2030 (target) |
||
|---|---|---|---|---|---|---|
| Domestic Group | Scope1+2 | 179 | 144 | 135 | 133 | 107 |
| Compared with FY2023 | ー | (35) | (44) | (46) | (72) | |
| NOF Group | Scope1+2 | 202 | 175 | 159 | 151 | ー |
| Compared with FY2023 | ー | (27) | (43) | (51) | ー | |
Scope 2 CO₂ emissions according to the location-based criteria and market-based criteria
[Covered organizations:NOF Group / Domestic Group]
(Thousand tons of CO₂)
| Location-based criteria | Market-based criteria | |||||
|---|---|---|---|---|---|---|
| FY2022 | FY2023 | FY2024 | FY2022 | FY2023 | FY2024 | |
| Domestic Group | 110 | 106 | 107 | 84 | 84 | 84 |
| NOF Group | 133 | 129 | 124 | 103 | 101 | 102 |
Scope 3 calculations (Thousand tons of CO₂)
| Category | FY2023 | FY2024 | Covered organizations |
Calculating method |
|---|---|---|---|---|
| 1) Purchased products and services |
453.3 | 520.5 | ※1 | Calculated by multiplying the quantity and cost of each item of purchased raw materials, consumables, and repair materials by emission intensity by division according to the databases*4 |
| 2) Capital goods | 53.3 | 52.5 | NOF Group | Calculated by multiplying acquisition cost of fixed assets by emission intensity according to the databases*4 |
| 3) Fuels and energy-related activities not included in Scope 1 or 2 |
36.8 | 38.0 | NOF Group | Calculated by multiplying the sum of fuel, electricity, and steam consumption by emission intensity according to the databases*4 |
| 4) Transportation and distribution (upstream) |
26.7 | 29.9 | ※2 | Calculated from ton-kilometers of transportation for purchased raw materials and ton-kilometers of transportation for delivered products for which NOF is the consignor; Calculated using the method prescribed under the reporting and disclosure system |
| 5) Waste generated in business activities |
9.7 | 10.7 | NOF Group | Calculated by multiplying the weight of each type of waste generated at production sites by emission intensity according to the databases*4 |
| 6) Business travel | 0.5 | 0.5 | NOF Group | Calculated by multiplying the number of employees by emission intensity according to the databases*4 |
| 7) Employee commuting | 1.4 | 1.1 | ※3 | Calculated by multiplying the amount of commuting expenses by emission intensity according to the databases*4 |
| 8) Leased assets (upstream) |
ー | ー | Not applicable, as no corresponding activities exist | |
| 9) Transportation and distribution (downstream) |
ー | ー | Not applicable, as no corresponding activities exist | |
| 10) Processing of sold products |
17.8 | 26.6 | NOF | Calculated by multiplying the sales volume of edible oils and industrial explosives by emission intensity according to the databases*4 |
| 11) Use of sold products | Not determined | Not determined | Not calculated due to difficulty in collecting the necessary data for calculation | |
| 12) End-of-life treatment of sold products |
0.6 | 292.3 | NOF | FY2023: Calculated for packaging materials of shipped products by multiplying the weight of each type with the emission intensity according to the databases*4 FY2024: Calculated by multiplying the weight of containers subject to the Containers and Packaging Recycling Law and the sales volume of chemical products requiring waste disposal with the emission intensity according to the databases*4 |
| 13) Leased assets (downstream) |
ー | ー | Not applicable, as no corresponding activities exist | |
| 14) Franchises | ー | ー | Not applicable, as no corresponding activities exist | |
| 15) Investments | ー | ー | Not applicable, as no corresponding activities exist | |
| Total | 600.1 | 972.1 |
- NOF on a standalone basis, 10 domestic affiliate companies (Nichiyu Kogyo Co., Ltd.; YUKA SANGYO CO., LTD.; NiGK Corporation; Showa Kinzoku Kogyo Co., Ltd.; Nippon Koki Co., Ltd.; Nippo Kogyo Co., Ltd.; NOF METAL COATINGS ASIA PACIFIC CO., LTD.; JAPEX Corp.; NIKKA COATING CO., LTD.; NICHIYU LOGISTICS CO., LTD.), and 2 major overseas affiliate companies (Changshu NOF Chemical Co., Ltd.; PT. NOF MAS CHEMICAL INDUSTRIES)
- NOF on a standalone basis, 7 domestic affiliate companies (Nichiyu Kogyo Co., Ltd.; YUKA SANGYO CO., LTD.; NiGK Corporation; Showa Kinzoku Kogyo Co., Ltd.; Nippon Koki Co., Ltd.; Nippo Kogyo Co., Ltd.; NOF METAL COATINGS ASIA PACIFIC CO., LTD.)
- 10 domestic affiliate companies (NICHIYU TRADING CO., LTD.; NICHIYU LOGISTICS CO., LTD.; Nichiyu Kogyo Co., Ltd.; YUKA SANGYO CO., LTD.; NiGK Corporation; Showa Kinzoku Kogyo Co., Ltd.; Nippon Koki Co., Ltd.; Nippo Kogyo Co., Ltd.; JAPEX Corp.; NOF METAL COATINGS ASIA PACIFIC CO., LTD.)
- Databases used: IDEA Ver. 3.5, IDEA Lab, Research Institute of Science for Safety and Sustainability, National Institute of Advanced Industrial Science and Technology (AIST); Emissions Intensity Database Ver. 3.5 for Calculating the Greenhouse Gas Emissions of Organizations through the Supply Chain (Ministry of the Environment)
Energy-saving initiatives
Energy consumption and CO₂ emissions
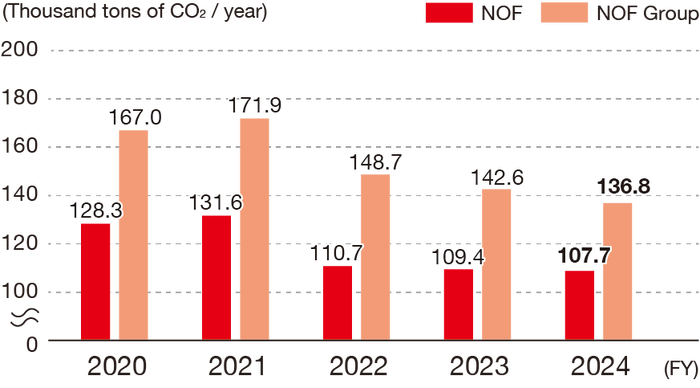
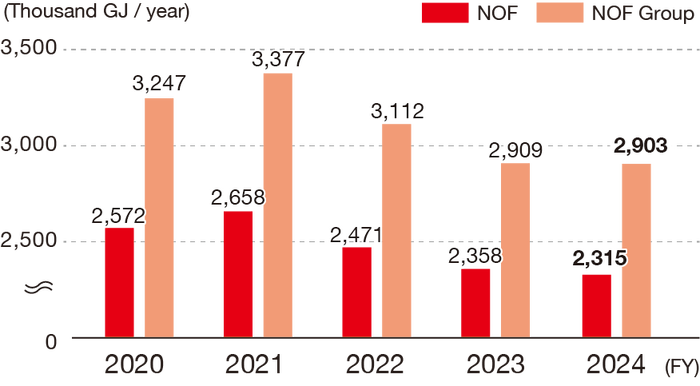
Energy consumption for fiscal 2024 decreased 0.2% from the previous year for the NOF Group, and decreased 1.9% from the previous year for NOF. The total volume of energy-derived CO₂ emissions decreased 4.0% from the previous year to 136,800 tons for the NOF Group, and decreased 1.6% from the previous year to 108,000 tons for NOF.
In addition, the energy intensity per unit of production for the NOF Group was 13.8 GJ/t, a 0.4% decrease year-on-year. For NOF, it was 14.1GJ/t, a 3.1% decrease. We will continue to steadily implement the efficient use of energy.
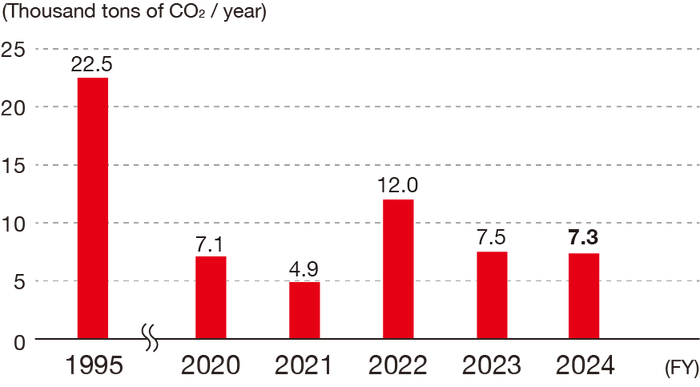
Changes in CO₂ emissions*1 by energy consumption
[Covered organizations:NOF Group]
Changes in energy consumption*2
[Covered organizations:NOF Group]
- The coefficient used in converting the electricity consumption into CO₂ emissions is the emission coefficient used by electric power supply companies in the fiscal year.
- Energy consumption is estimated using 9.76 MJ/kWh as the coefficient when converting electric power consumption into the calorific value.
CO₂ emissions other than from energy consumption
At the Aichi Works, NOF manufactures products for specific purposes using perfluorocarbon (PFC), which has a high global warming coefficient, as the diluent for organic peroxides.
In fiscal 2024, PFC emissions decreased approximately 3% from fiscal 2023, due in part to the effects of facility improvements. Going forward, we will aim to reduce emissions through efforts such as maintaining steady operation of recovery equipment and further promoting the use of alternative diluent.
Changes in PFC emissions
[Covered organizations:NOF]
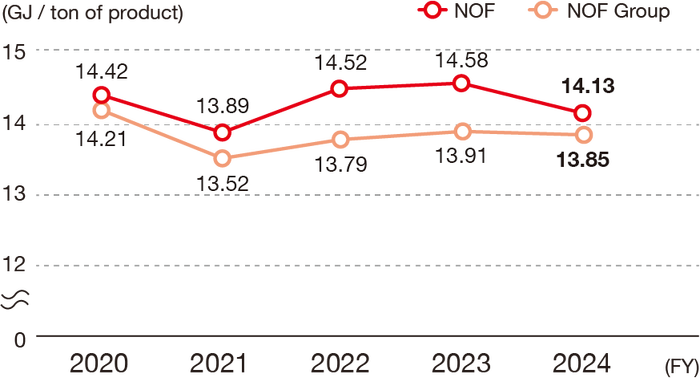
Changes in energy intensity per product
[Covered organizations:NOF Group]
Energy-saving initiatives
The energy consumption (crude oil equivalent) by the NOF Group in fiscal 2024 was 74,890 kl, down 0.2% from fiscal 2023. The energy consumption per sales (crude oil equivalent) was 0.31 kl/ million yen, down 8.8% from fiscal 2023. By trialing internal carbon pricing and adding it to the economic benefits of small group activities, we are encouraging greater motivation for energy-saving activities such as process improvements and reducing steam consumption through the replacement of steam traps.
These achievements stem from the promotion of energy-saving activities, including reductions in steam usage through process improvements and the management of heat-related equipment.
By reviewing the operation of heating processes and optimizing the required amount of steam, we improved the overall energy efficiency of our facilities and contributed to a reduction in energy consumption.
In addition, to effectively utilize thermal energy, we use steam trap diagnostics to detect equipment deterioration or failures at an early stage, thereby maintaining equipment and ensuring efficient use of thermal energy. We also perform thermal imaging diagnostics on equipment and piping to visualize heat loss, enabling us to promptly implement countermeasures against it.
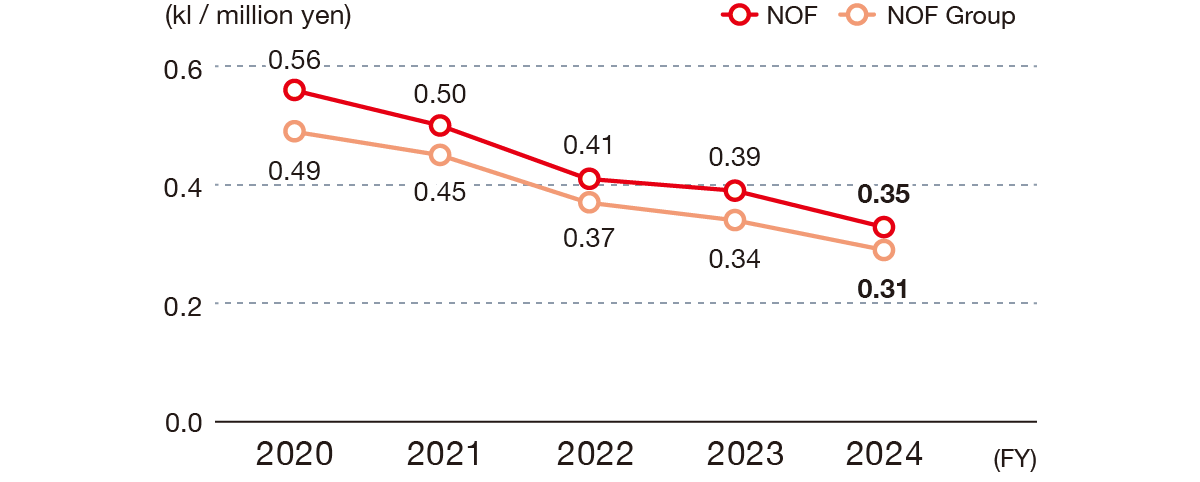
Changes in energy intensity related to sales
[Covered organizations:NOF Group]
Renewable energy measures (domestic)
The NOF Group’s initiatives in the area of renewable energy include the installation of solar power generation facilities at the Kawasaki Works in 2018 and NiGK Corporation in November 2020 to supply renewable energy for part of the electricity used in production activities. Since then, we have continued installing solar power generation facilities as much as possible, such as on newly constructed production facility buildings, as well as on the rooftops of company housing and dormitories built as employee welfare facilities, thereby promoting initiatives toward a low-carbon society.
Initiatives to reduce CO₂ emissions through the use of biomass fuel
At PT. NOF MAS CHEMICAL INDUSTRIES (NMC) in Indonesia, where palm oil is produced, we are working to reduce CO₂ emissions by sourcing boiler fuel from palm kernel shells (PKS), a biomass fuel made from waste generated after oil extraction.
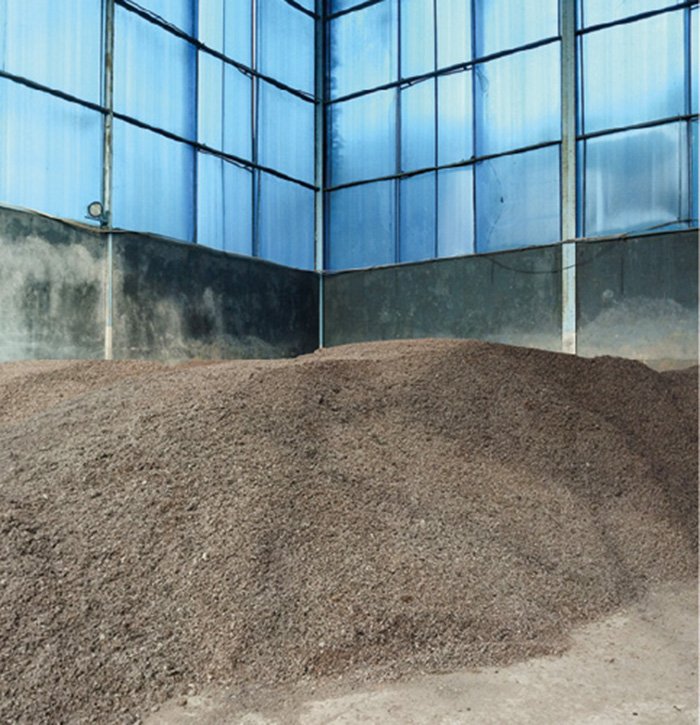
Biomass fuel (palm kernel shells)
Boiler using biomass fuel
Track record of solar power introduction
| Works / plants | Power generation capacity (kW) | Average sunlight hours | Operating days | Power generation results (MWh/year) |
|---|---|---|---|---|
| Daishi Plant | 16.6 | 2.6 | 365 | 15.6 |
| Amagasaki Plant (Kansai company housing) |
10 | 4.5 | 365 | 16.5 |
| Kinuura Plant (Warehouse No. 38) |
20 | 4.2 | 242 | 20.2 |
| NiGK Corporation (Kawagoe Plant) |
10 | 5.3 | 365 | 19.2 |
| PT. NOF MAS CHEMICAL INDUSTRIES (NMC) | 102 | 3.2 | 31 | 10.1 |
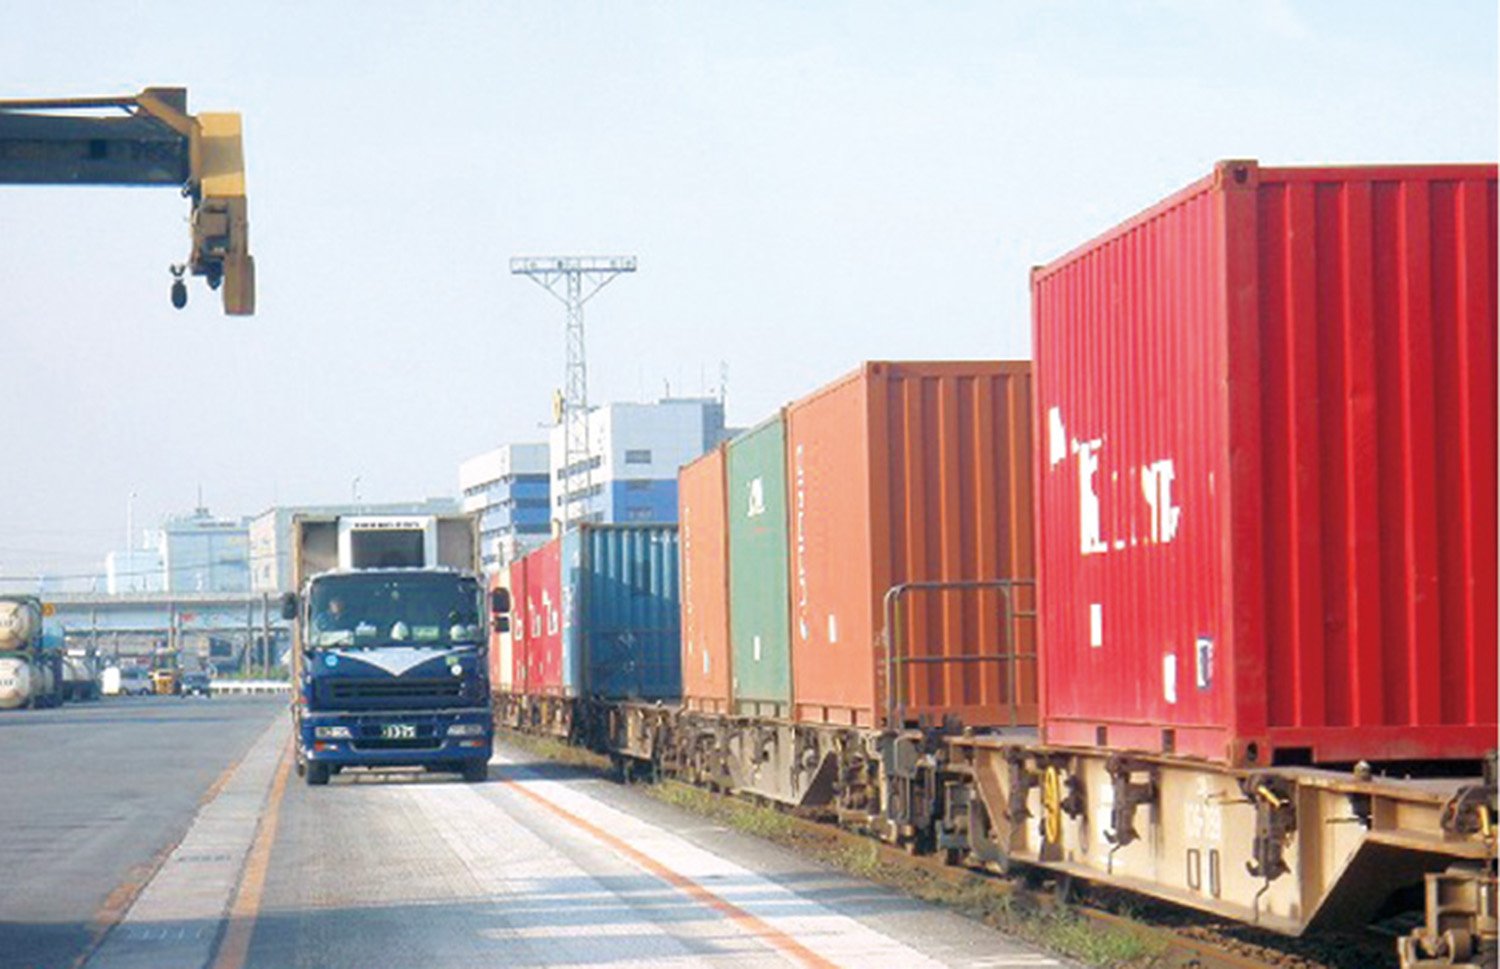
Status of transport initiatives
CO₂ emissions intensity during transportation
Since the operational launch of our integrated delivery system in fiscal 2006, NOF has been endeavoring for more efficient transportation. NOF has also been tackling modal shifts* and joint delivery.
As a result of advancing a modal shift from truck transport to rail transport, the share of rail and marine transport in total cargo volume has reached 19.3%.
In terms of CO₂ emissions intensity during transportation, if we take fiscal 2006—the first year of implementing the integrated delivery system—as 100, the figure for fiscal 2024 was 42.1.
- CO₂ emissions intensity during transportation=∑(CO₂ emitted by each means of transport) / Net sales
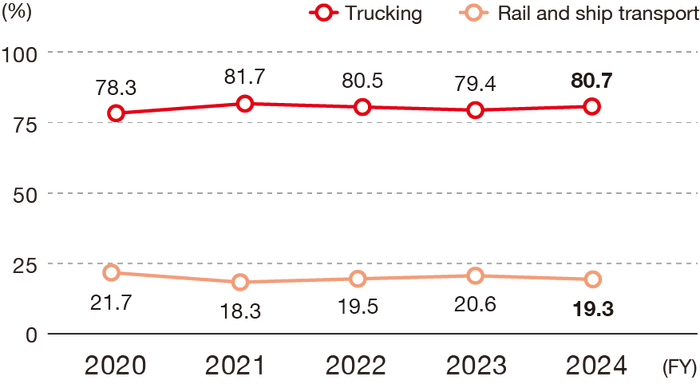
Transportation modal shifts
[Covered organizations:NOF]
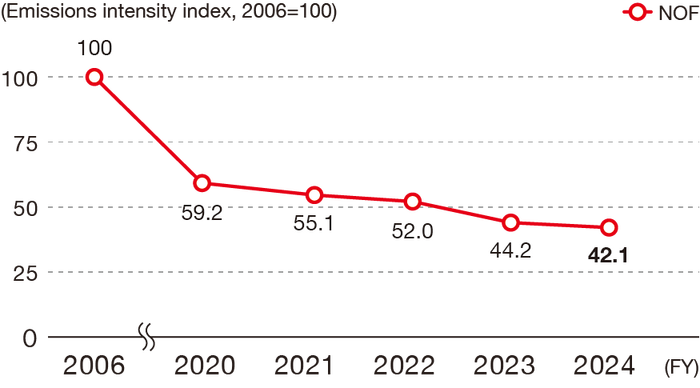
CO₂ emissions intensity related to transportation
[Covered organizations:NOF]
Modal shifting
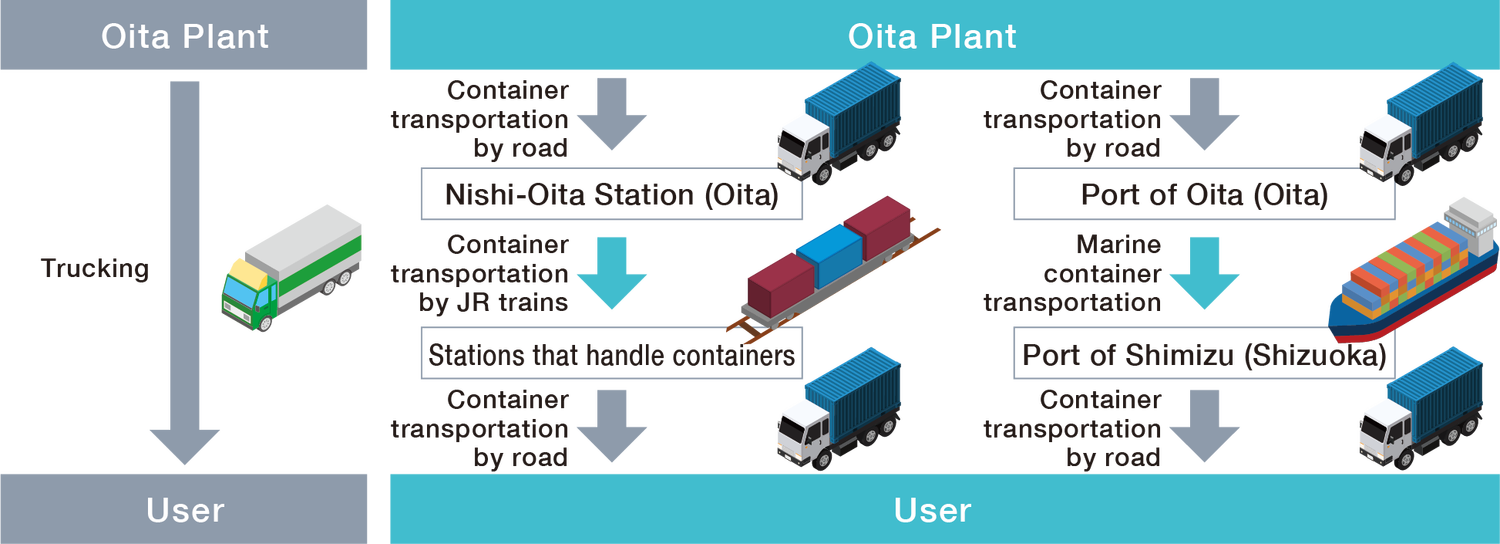
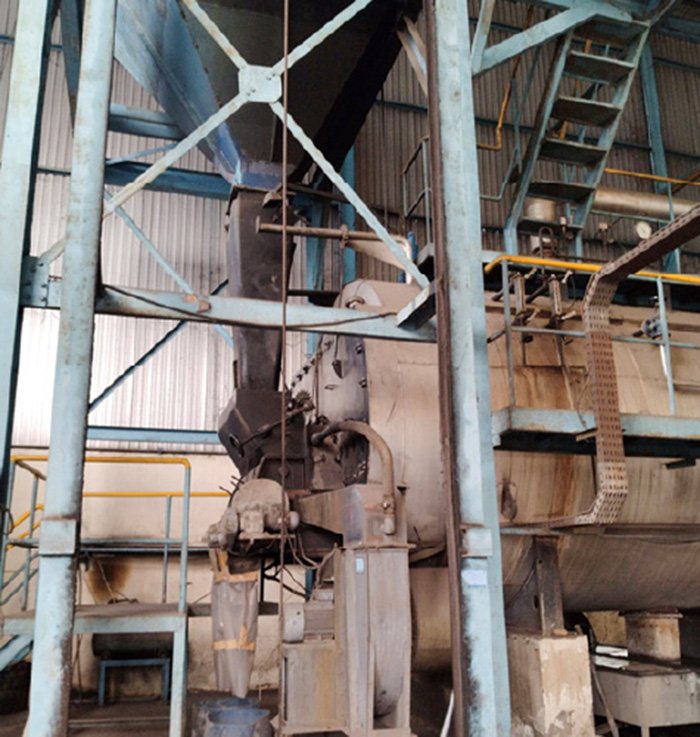
Oita Plant modal shifting scheme