

Environment
Air Emissions

Policy
Policy (our fundamental view)
The NOF Group actively carries out initiatives to prevent air pollution in accordance with the Management Policy Regarding Responsible Care.
- We manage atmospheric emissions generated from operations and comply with laws and regulations.
- We set targets and continuously pursue technical improvements to reduce atmospheric emissions.
- We take into account the impact on local communities and strive to minimize environmental burdens.
Basis for Policy*1
Policy 1: Manufacturing Business Guideline 8
“To reduce environmental impact, we comply with relevant laws and regulations, and establish management systems for atmospheric emissions, discharges to sewage treatment plants, rivers,
and oceans, as well as for industrial waste and other outputs associated with operations.”
Policy 2: Manufacturing Business Guideline 8
“We set targets for reducing emissions as well as for minimization, volume reduction, recovery, treatment, and improved sorting of industrial waste, and will continue to make
technical improvements.”
Policy 3: Manufacturing Business Guideline 7
“We pay due attention to the concerns of local residents regarding relevant product manufacturing, enhance communication with them, and establish systems that can provide
appropriate information.”
Prevention of air pollution
In accordance with the Management Policy Regarding Responsible Care, the NOF Group measures sulfur oxides (SOx), nitrogen oxides (NOx), soot and dust*2, and other substances contained in exhaust gases from boilers and other combustion facilities to prevent air pollution, and manages operations in strict compliance with national and local environmental standards.
We are currently advancing SOx emission reduction plans, including converting boiler fuel from Type A heavy oil, a major source of SOx emissions, to city gas.
In addition, there have been no cases of violations of laws and regulations related to emissions into the atmosphere.
Changes in Exhaust Gas Monitoring Items (Tons/year)
| Category | FY2021 | FY2022 | FY2023 | FY2024 | FY2025 | |
|---|---|---|---|---|---|---|
| NOF | SOx | 1.9 | 2.6 | 4.9 | 2.1 | 1.0 |
| NOx | 48.0 | 49.1 | 52.9 | 40.6 | 43.3 | |
| Soot and dust | 1.1 | 0.9 | 0.9 | 0.9 | 1.2 | |
| Domestic Group | SOx | 3.3 | 4.4 | 6.5 | 3.4 | 2.6 |
| NOx | 49.6 | 50.6 | 54.4 | 41.1 | 43.8 | |
| Soot and dust | 1.1 | 0.9 | 1.0 | 0.9 | 1.2 | |
| NOF Group | SOx | 4.6 | 6.5 | 8.2 | 4.7 | 3.0 |
| NOx | 55.3 | 55.4 | 58.1 | 45.8 | 45.3 | |
| Soot and dust | 4.1 | 4.6 | 2.6 | 4.4 | 1.5 | |
| Violations of laws and regulations (no.) | 0 | 0 | 0 | 0 | 0 | |
Volatile organic compounds (VOCs)
Following the May 2004 amendment to the Air Pollution Control Act, VOC emission regulations have been in effect since April 1, 2006. This legal amendment combined “regulation” and “voluntary initiatives” appropriately for the first time in Japan’s environmental legal system, with a target of reducing atmospheric VOC emissions by approximately 30% by FY2010 compared with FY2000.
NOF Group’s FY2000 PRTR emissions, including VOCs, were 461 tons on a non-consolidated basis. By FY2010, emissions were 216 tons for NOF and 269 tons for the Domestic Group, achieving a 53% reduction from FY2000. Since then, we have continued systematic reductions and further lowered emissions. We will continue striving to monitor and reduce emissions, including VOCs and hazardous air pollutants.
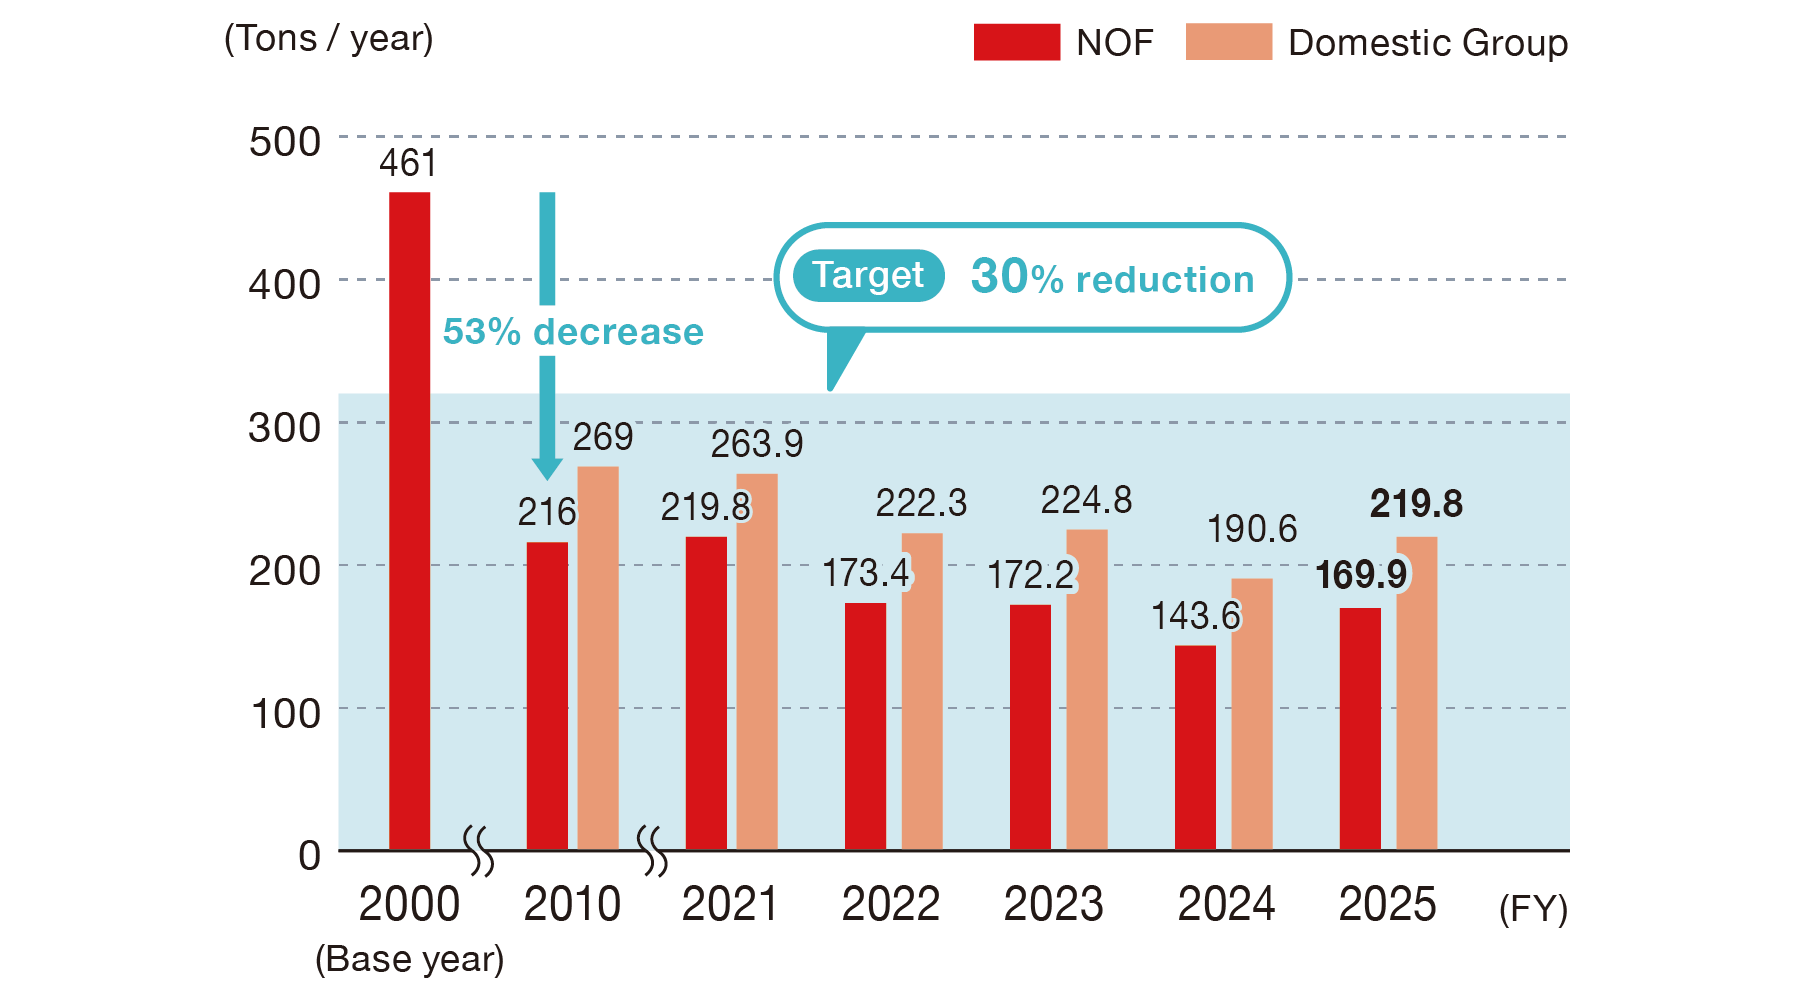
Changes in VOC Emissions*
[Covered organizations:Domestic Group]
Hazardous air pollutants
Hazardous air pollutants are chemical substances that may pose risks to human health through long-term exposure even at low concentrations. Based on the list of chemical substances revised in the October 2010 report (9th report) of the Central Environment Council, we are working to monitor and reduce emissions of 15 designated substances.
The Domestic Group’s emissions of these substances in fiscal 2025 amounted to 89 tons. We position emission reductions as an important issue and actively pursue process improvements and equipment installation. In addition, through technological innovation and R&D, we are exploring new reduction methods and contributing to the realization of a sustainable society.
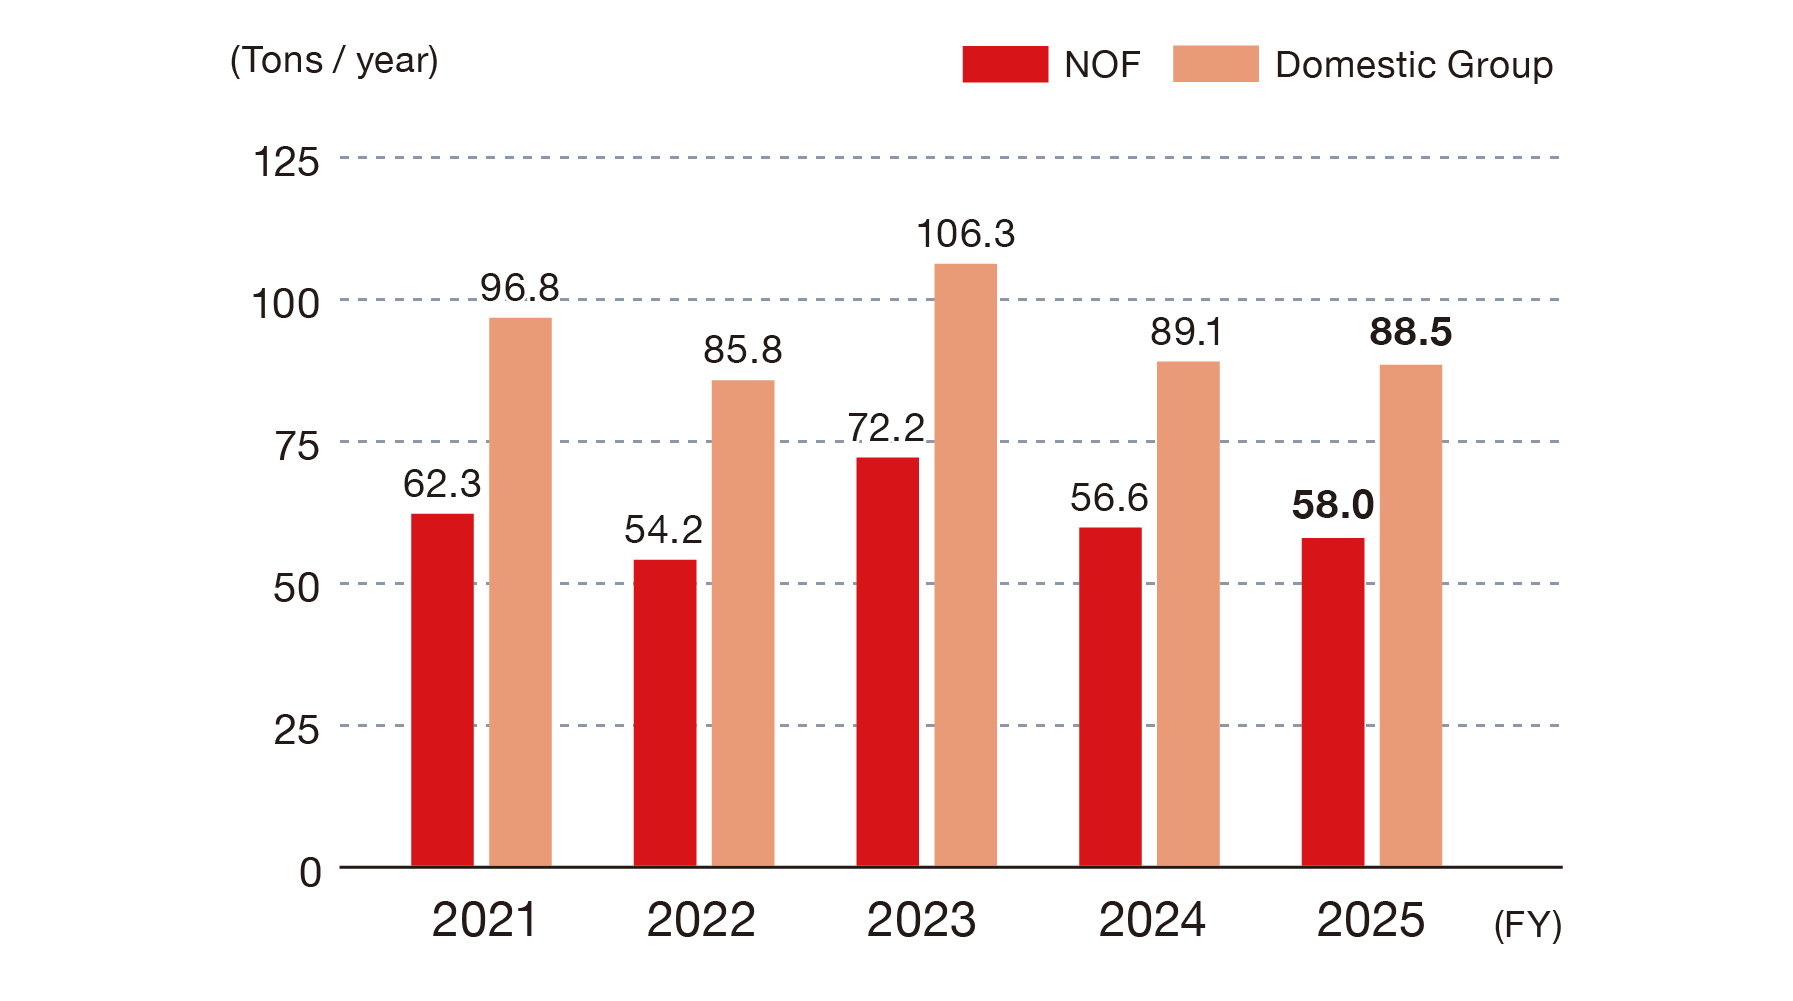
Hazardous Air Pollutants*
[Covered organizations:Domestic Group]
Reduction of fluorocarbon emissions
In accordance with the Act on Rational Use and Proper Management of Fluorocarbons (Fluorocarbon Emissions Control Act), which covers the entire life cycle of fluorocarbons from production to disposal, we have been carrying out simple and periodic inspections according to plan, as required by the law.
In FY2025, we estimated leakage of fluorocarbons amounted to 661 tons of CO₂e at the Kawasaki Works, 677 tons of CO₂e at the Aichi Works, and 25 tons of CO₂e at the Amagasaki Plant, bringing the total for our company to 1,884 tons of CO₂e.
We will continue to strengthen inspections and maintenance, and ensure proper disposal of equipment. We will also promote the replacement of existing equipment to equipment that uses refrigerants with lower global warming and ozone depletion potentials and further reduce fluorocarbon leaks.
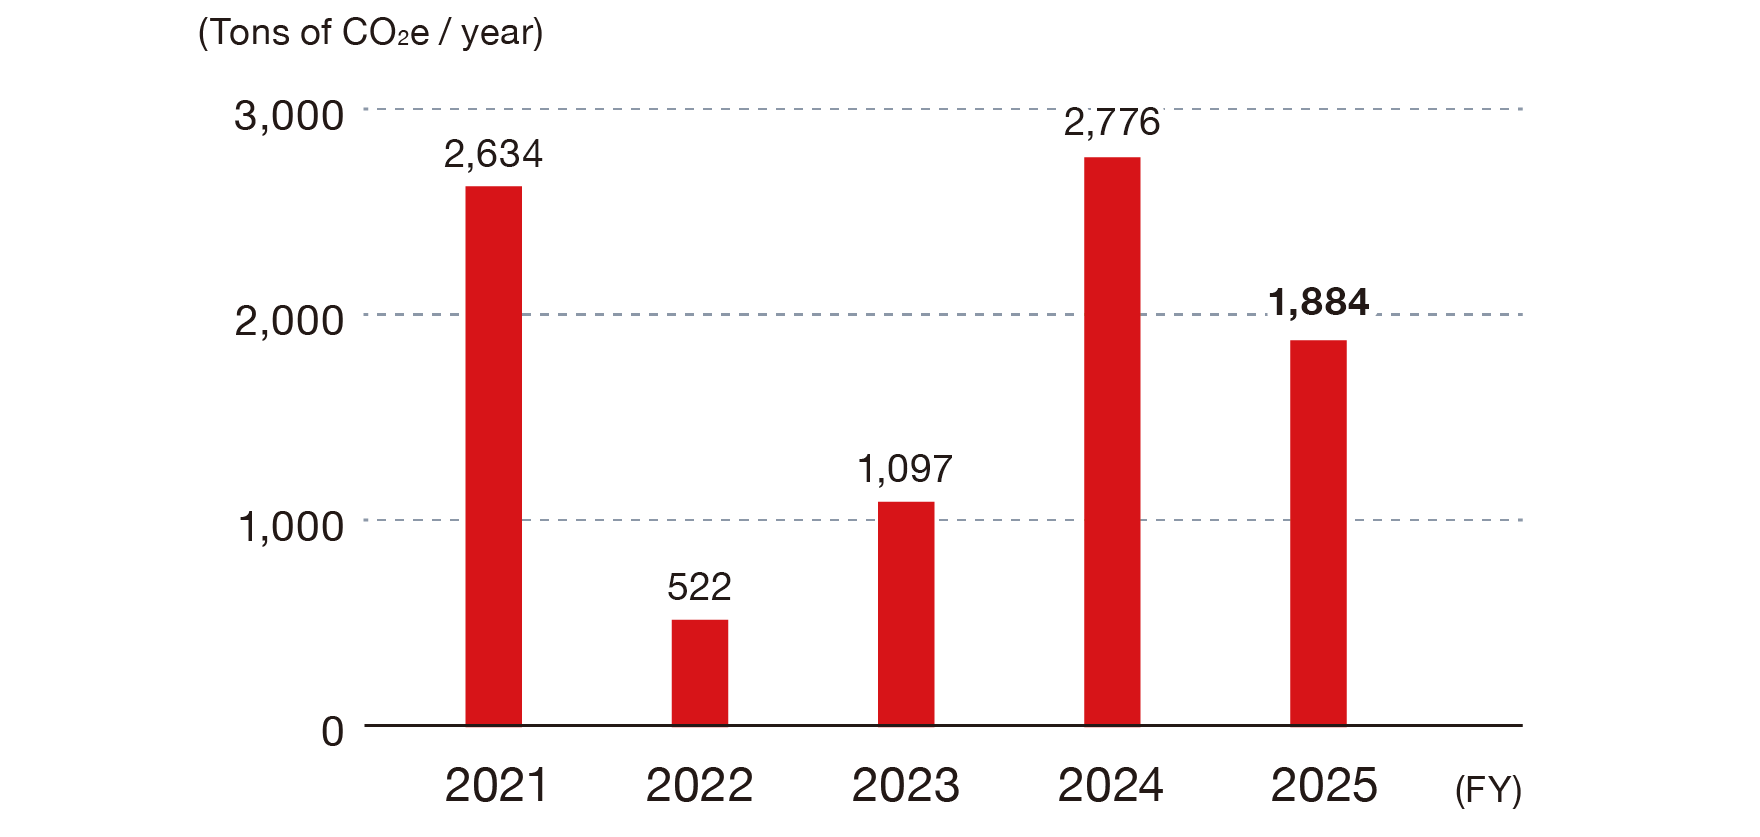
Calculated Fluorocarbon Leaks
[Covered organizations:NOF]
Fluorocarbon Countermeasure Rating
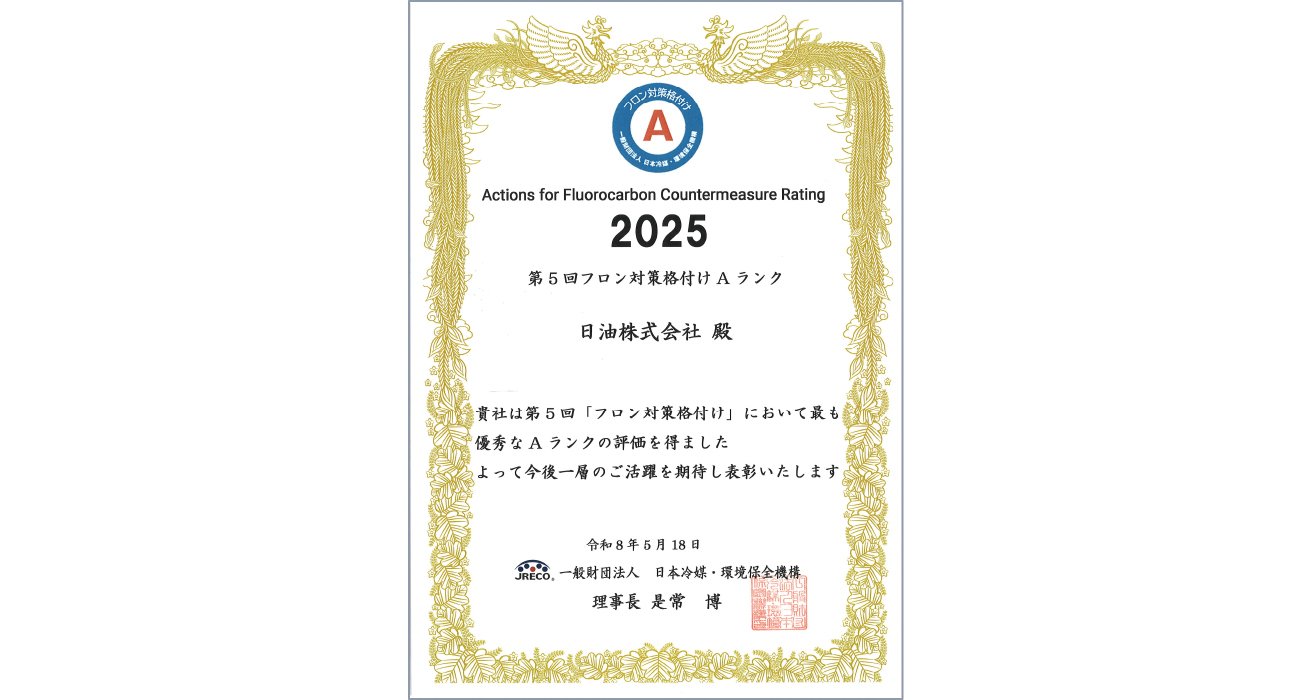
NOF’s fluorocarbon countermeasures were recognized under the “JRECO Fluorocarbon Countermeasure Rating,” earning the highest A rating for two consecutive years.
PRTR Act-controlled substances
The emission volume of PRTR Act-controlled substances by the Domestic Group in FY2025 was 139.1 tons, an increase of approximately 3% from 135.1 tons in the previous fiscal year.
As a result, about 48% reduction of emissions volume was achieved from the 269 tons in fiscal 2010, the reference year of the Mid-term Target.
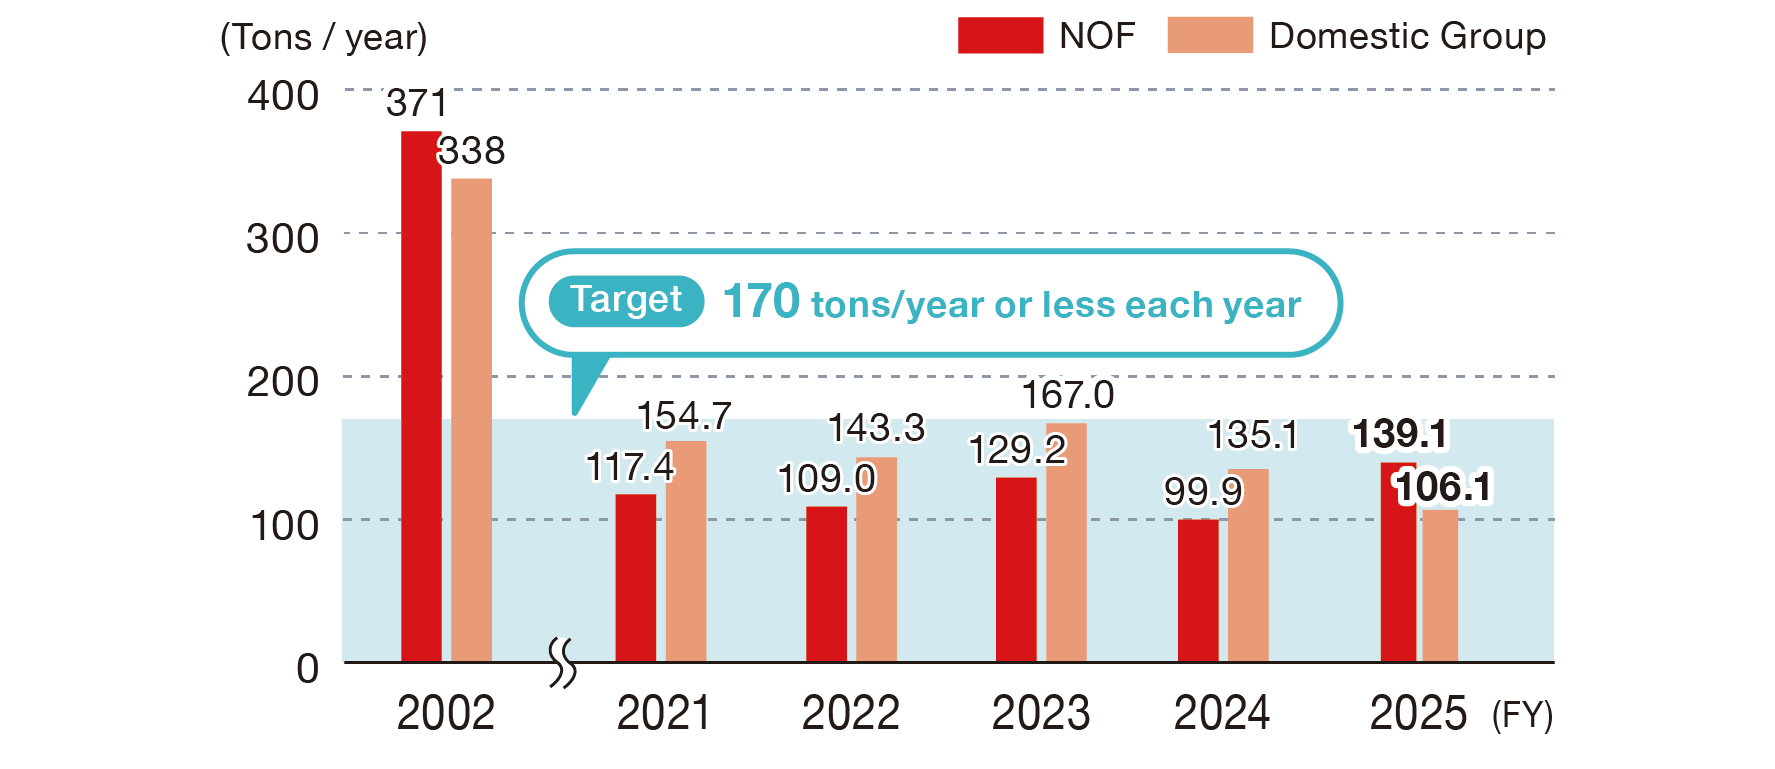
Changes in Emissions of PRTR Act-controlled Substances
[Covered organizations:Domestic Group]
PRTR Act-controlled substances with an emissions volume of 10 tons or more are indicated in the table below.
Substances High in Volume (10 tons or more) Discharged into the Environment [Covered organizations:Domestic Group]
| Cabinet order No. | Name | Emission volume (tons/year) |
|---|---|---|
| 186 | Dichloromethane | 35.3 |
| 300 | Toluene | 33.5 |
| 83 | Cumene | 16.9 |
| 128 | Chloromethane | 15.3 |
Measures to reduce emissions of PRTR Act-controlled substances
NOF has set a target of keeping annual emissions of PRTR Act-controlled substances at 170 tons or less. In particular, we are examining manufacturing methods in which PRTR Act-controlled substances are not used in order to reduce the amount of substances with high environmental emissions. We aim to reduce emissions through the adoption of alternative substances and environmentally friendly manufacturing methods.
We also optimize the operating conditions of recovery equipment to increase the volume of emissions recovered. Regular maintenance and proper operation and management ensure effective recovery and lead to reduced emissions.
NOF will continue its efforts to reduce emissions of PRTR Act-controlled substances and promote more environmentally friendly manufacturing activities. In this way, we will contribute to the achievement of a sustainable society and work to protect the global environment.
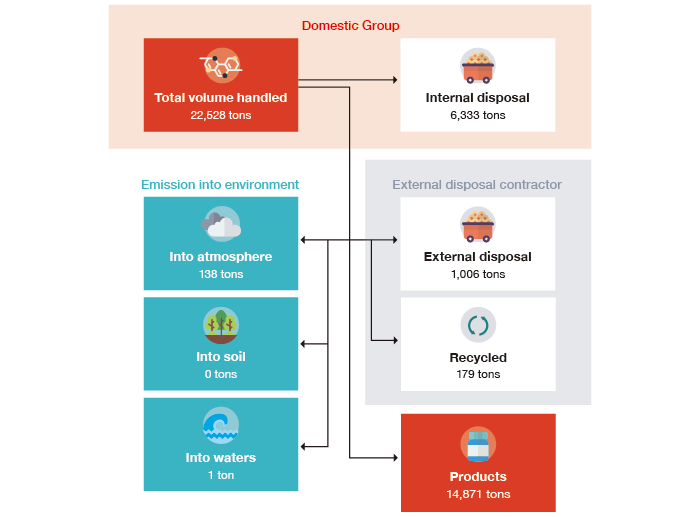
Balance of Emissions of PRTR Act-controlled Substances (FY2025)
[Covered organizations:Domestic Group]
Risks and opportunities
The NOF Group recognizes both the risks and opportunities related to atmospheric emissions and is implementing measures to address them. In terms of transition risks, tightening domestic and international regulations may lead to higher costs from capital expenditures and the potential loss of business opportunities if production of existing products is discontinued. Delays in regulatory compliance or in developing eco-friendly products may also damage our reputation among investors, customers, and local communities, posing a risk to the Group’s standing.
As physical risks, facility damage caused by natural disasters such as typhoons and volcanic eruptions could directly result in halted production activities and decreased sales.
On the other hand, growing demand for products that help mitigate air pollution presents opportunities for the NOF Group. The development of eco-friendly products such as waterborne anti-corrosion coatings and cement capsules is expected to enhance the Group’s reputation and lead to the acquisition of new market opportunities. We implement measures such as those illustrated below to prevent air pollution while also identifying the associated potential risks. For example, switching boiler fuel from heavy oil to LNG can significantly reduce SOx and other emissions. Although LNG vaporization equipment consumes energy, its impact is considered small compared with the GHG emissions from heavy-oil boilers.
Introducing VOC recovery equipment (adsorption, recovery, or combustion) can also reduce emissions of target substances. However, energy is consumed to reuse adsorbents, recover substances through cooling, and perform combustion treatment, while spent adsorbents also increase waste.
Risks and Opportunities for Atmospheric Emissions
| Category | Major risks and opportunities |
Overview | Countermeasures |
|---|---|---|---|
| Transition risks |
Tighter domestic and international regulations |
|
①Creation and execution of emission
②Reevaluation of production processes |
| Deterioration of evaluation/reputation |
|
|
|
| Physical risks |
Natural disasters |
|
|
|
|
||
| Opportu- nities |
Growing needs for products that contribute to mitigating air pollution |
[Mitigation of air pollution]
|
|
| Improvement of evaluation and reputation |
|
|