Environment
Resource Recycling / Waste
Policy
Policy (our fundamental view)
The NOF Group prioritizes conducting the following efforts as resource circulation initiatives.
- Promotion of the sale of valuable waste and internal processing: We sell waste as valuable resources and actively promote internal processing. This promotes the efficient use of resources through the reuse and recycling of waste.
- Reduction of waste generated by maintaining separate disposal and improving processes: By maintaining separate waste disposal and improving processes, we are reducing the amount of waste generated. This initiative prevents resources from going to waste and ensures their efficient use.
- Ongoing search for recycling processing contractors as well as processing implementation: We work continuously with recycling and disposal contractors and actively implement waste recycling processing. This initiative promotes the reuse of resources, efficient use of resources, and reduction of waste.
- Landfill reduction through recycling of existing waste: By recycling existing waste, we are reducing disposal into landfills. Through this initiative, we are effectively utilizing resources and contributing to the reduction of waste and environmental impact.
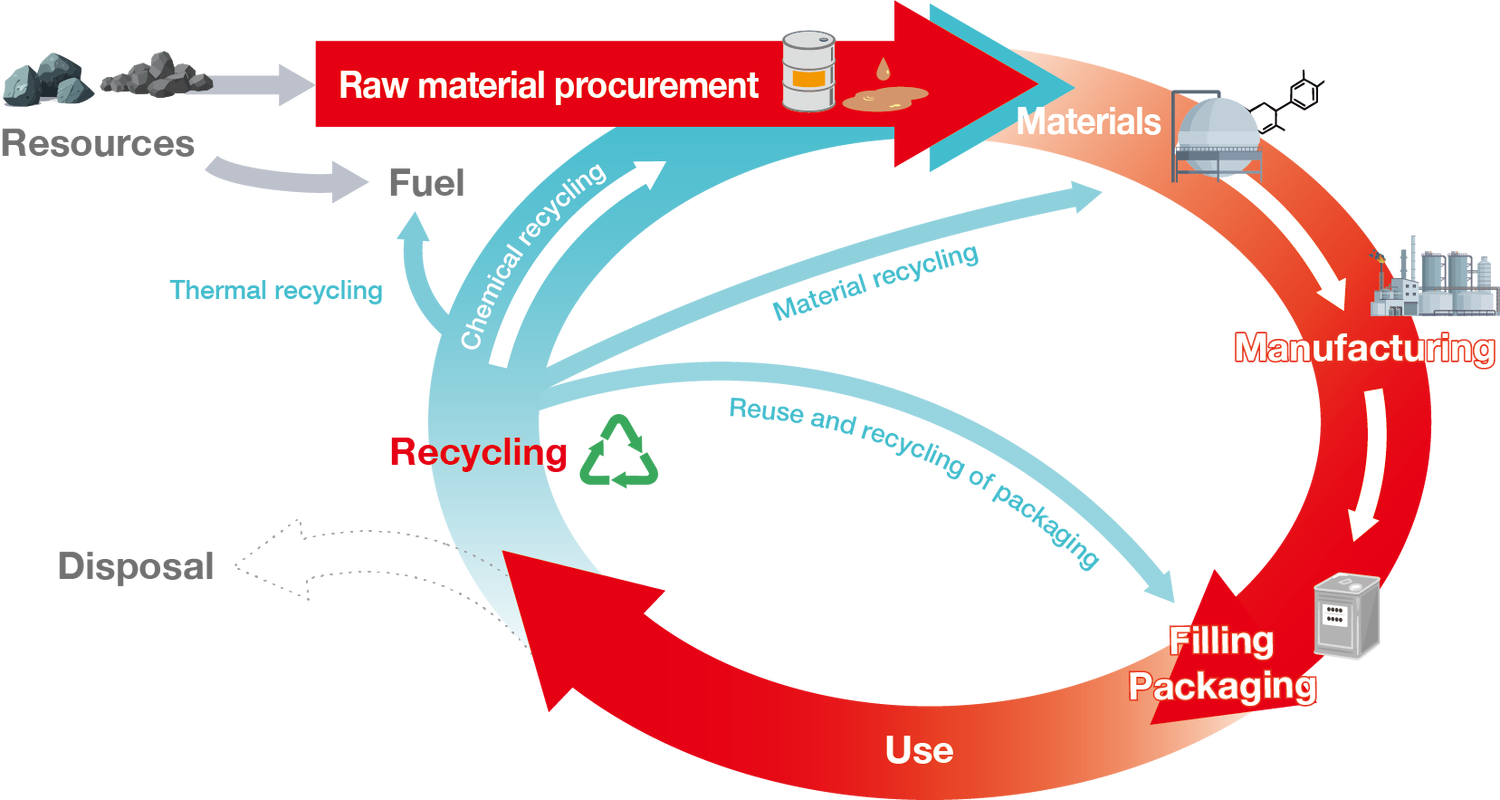
The circular economy is an economic model that aims to create sustainable value through the efficient use of resources and the minimization of waste. It promotes reuse and recycling, reduces environmental impact, and contributes to the long-term enhancement of corporate value.
Resource Recycling Targets
The NOF Group promotes resource recycling efforts by setting targets.
- Zero emissions*1 rate: 0.10% or lower annually We promote waste separation and recycling, and reduce the generation of waste disposed of in landfills as much as possible.
- Waste plastic recycling*2 rate: 94% or more annually (from FY2024) We are advancing the recycling of waste plastics for recycling and effective use of resources.
- Here, this means an endeavor to make the disposal quantity of industrial waste through corporate and production activities close to zero.
Definition of zero emissions rate:(Volume of final disposal by landfill / volume of waste, etc. generated) × 100 - Definition of recycling rate:
(Volume of waste plastics recovered through thermal, material, or chemical processing / Waste plastics generated) × 100
Initiatives Toward Saving Resources
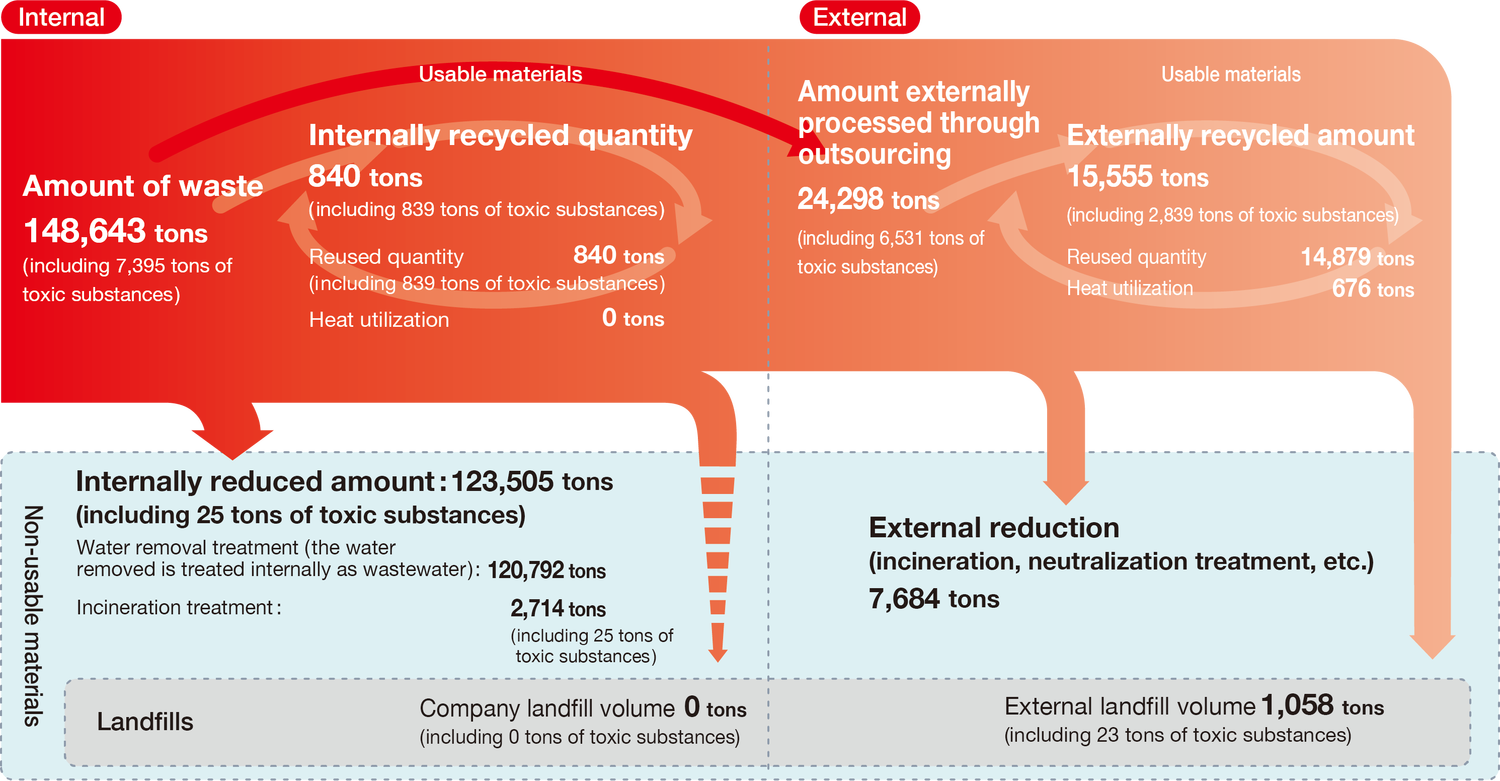
In fiscal 2024, the NOF Group generated 148,643 tons of waste, of which 83.1% was reduced through internal weight reduction measures and 16.3% was outsourced for external processing. As for the breakdown of the waste externally processed via outsourcing, 10.5% was recycled externally, 5.2% was reduced externally, and 0.7% was disposed via landfills, for a recycling rate of 11.0% of the total waste generated.
As part of our resource circulation efforts, we are improving processes to increase yield and reduce the amount of waste generated, promoting the sale of valuable waste and internal processing, recycling existing waste for landfill reduction, maintaining separate disposal and reducing waste generated, and continuously searching for plastic waste recycling and disposal contractors and advancing processing by them. We will continue to actively work to promote resource circulation, reduce waste, and lessen our environmental impact.
Waste generated by the NOF Group[Covered organizations:NOF Group]
Promotion of Drive Toward Zero Emissions
In fiscal 2024, the final landfill disposal volume for the Domestic Group was 72.2 tons, for a zero emissions rate of 0.047%.
Meanwhile, NOF’s final landfill volume was 65.3 tons, with the zero emissions rate standing at 0.043%.
We will continue to promote separate collection of waste and recycling to reduce the final disposal volume by landfill.
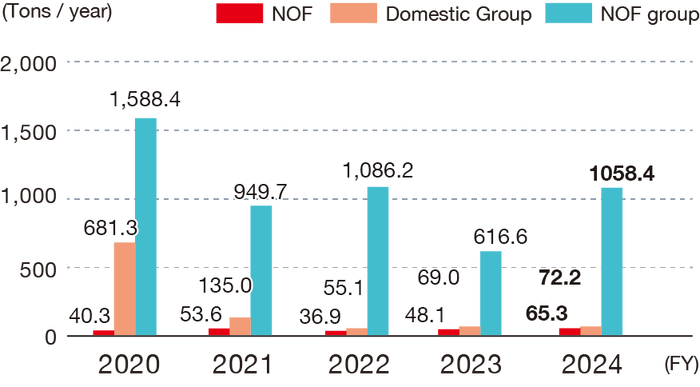
Changes in final disposal volume by landfill
[Covered organizations:NOF Group]
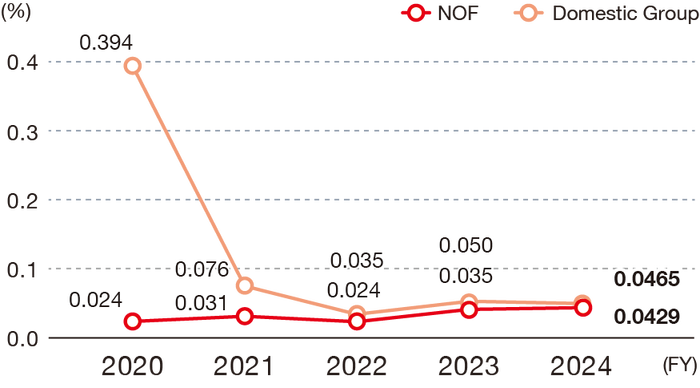
Changes in zero emissions rate
[Covered organizations:Domestic Group]
Recycling of Valuables from Waste
In fiscal 2024, the NOF Group’s waste plastic emissions increased by 50 tons to 890 tons, and the recycling ratio against the emission amount improved to 99%. In addition, the Domestic Group’s sales from the recycling of waste amounted to 249 million yen.
We will continue to actively sort and recycle waste plastics and also continue our recycling efforts.
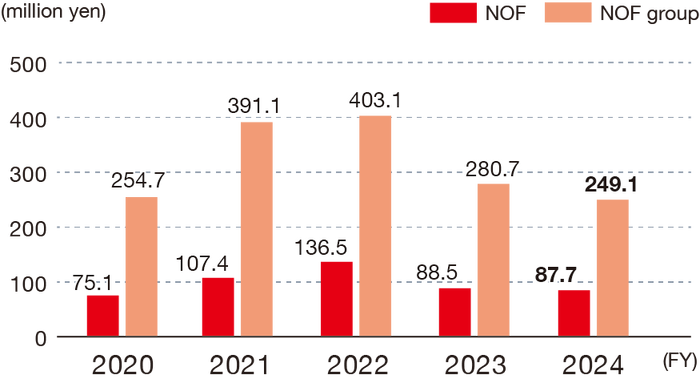
Changes in sum of valuables sold
[Covered organizations:NOF Group]
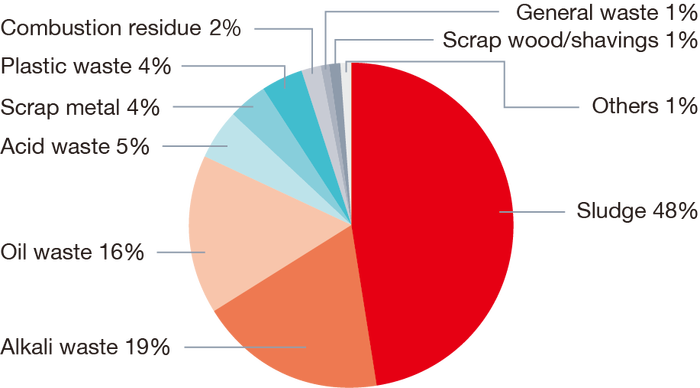
Breakdown of waste quantity from plants (FY2024)
[Covered organizations:NOF Group]
Changes in waste quantity from plants (tons)
| Category | FY2020 | FY2021 | FY2022 | FY2023 | FY2024 |
|---|---|---|---|---|---|
| NOF Group | 28,955 | 29,164 | 25,157 | 22,541 | 24,298 |
| Domestic Group | 24,176 | 23,796 | 21,270 | 19,132 | 20,979 |
| NOF | 22,529 | 22,822 | 20,493 | 18,463 | 20,222 |
Breakdown of processed waste quantity from plants (FY2024)(tons)
| Category | Waste quantity from plants | Recycled amount | External disposal quantity | Final disposal quantity by landfill |
|---|---|---|---|---|
| NOF Group | 24,298 | 15,555 | 7,684 | 1,058 |
| Domestic Group | 20,979 | 14,605 | 6,302 | 72 |
| NOF | 20,222 | 13,935 | 6,222 | 65 |
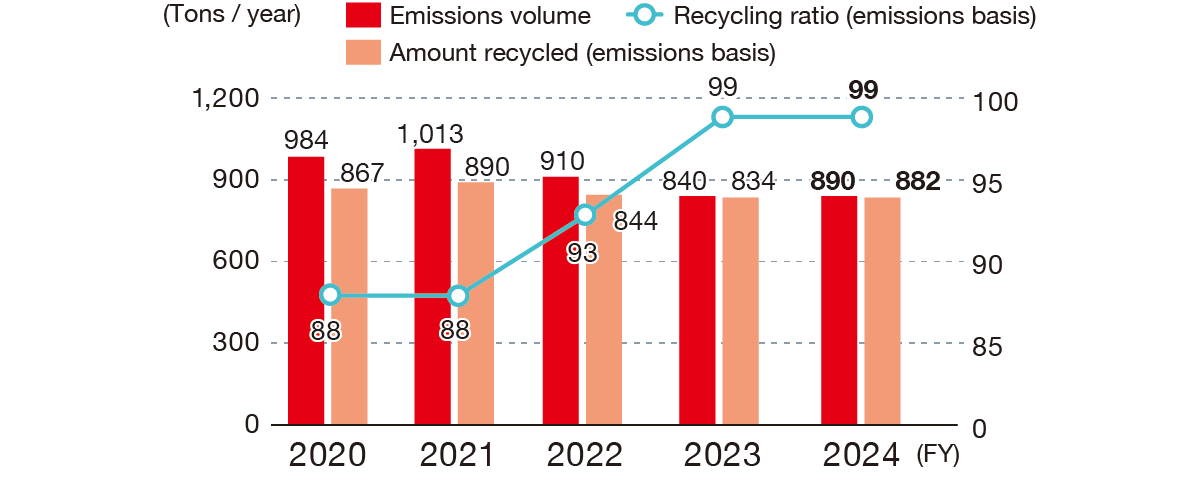
Changes in amounts of plastic waste recycled and recycling rates
[Covered organizations:NOF Group]