Environment
Environmental Accounting

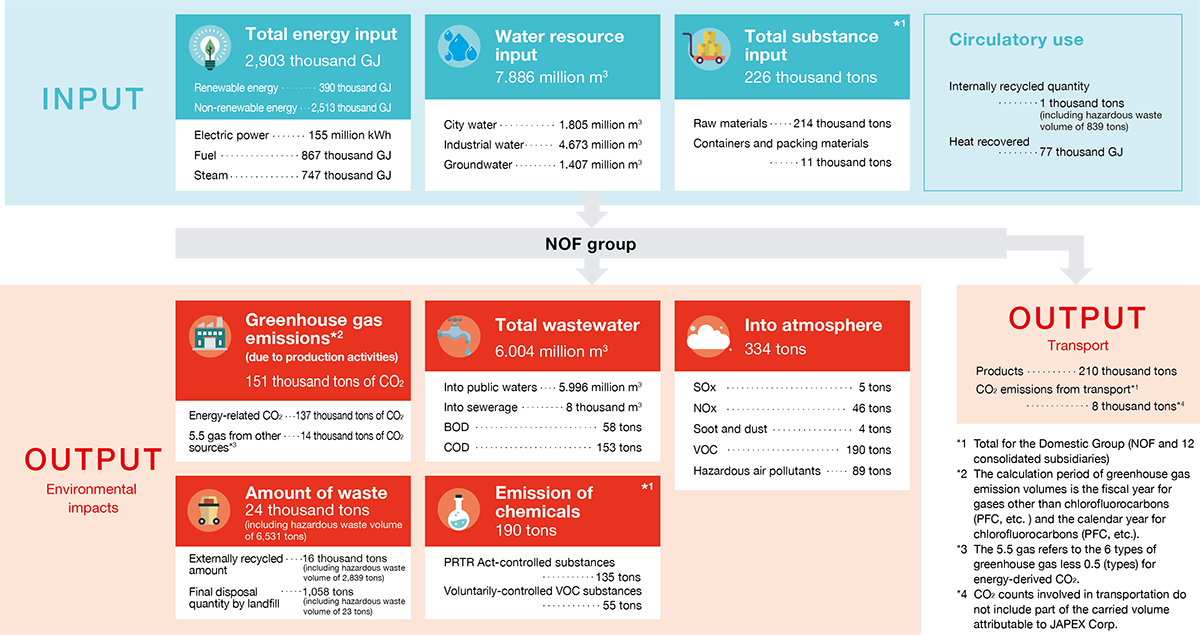
Mass balance
The status of environmental impact ensuing from business activities by the NOF Group in fiscal 2024 is shown below.
Environmental Accounting
Environmental accounting*1 of the Domestic Group in fiscal 2024 is stated below. The period covered is from April 1, 2024 through March 31, 2025.
Environmental expenses[Covered organizations:NOF Group] (Unit:millions of yen)
| Category | Details of major initiatives | Investments | Expenses | |
|---|---|---|---|---|
| 1) Business area expenses |
-1 Pollution prevention | Upgrade of steam ejectors, enhancement of wastewater treatment plants | 238 | 1,095 |
| -2 Global environmental conservation |
Upgrade to high-efficiency plants, replacement of fluorescent lights to LEDs | 951 | 625 | |
| -3 Resource recycling | Upgrade of resource recycling plants, industrial waste treatment expenses | 8 | 956 | |
| (2) Upstream/downstream expenses |
Expenses for more eco-friendly containers and packaging materials | 10 | 5 | |
| (3) Management activity expenses |
Environmental audits, improvements, personnel costs | 0 | 526 | |
| (4) R&D expenses |
Curbing environmental impact | 0 | 0 | |
| (5) Community activity expenses |
Expenses related to supporting regional environmental conservation activities | 0 | 9 | |
| (6) Environmental damage response expenses |
− | 0 | 243 | |
| (7) Other expenses |
20 | 0 | ||
| Total*2 |
1,227 | 3,459 | ||
Environmental conservation results[Covered organizations:NOF Group]
| Category | Item | FY2024 | vs. FY2023 |
|---|---|---|---|
| (1) Environmental conservation results from resources used in business activities |
Total energy input (thousand GJ) | 2,903 | (6) |
| Total substance input (thousand tons) | 224 | (24) | |
| Water resource input (thousand ㎥) | 7,886 | (472) | |
| (2) Environmental conservation results from environmental impact and waste materials generated from business activities |
Greenhouse gas emissions (thousand tons of CO₂) | 151 | (18) |
| Production activities:Energy-related | 137 | (6) | |
| Production activities:Other | 14 | (3) | |
| Transportation-related | 8 | (2) | |
| Emissions of PRTR Act-controlled substances (tons) | 135 | (32) | |
| Plant emission volumes (tons) | 24,298 | 1,757 | |
| Final disposal of waste by landfill (tons) | 1,058 | 441 | |
| Wastewater volume (thousand ㎥) | 6,004 | (86) | |
| COD emissions (tons) | 153 | (18) | |
| NOx emissions (tons) | 46 | (12) | |
| SOx emissions (tons) | 5 | (3) |
Real economic effects[Covered organizations:NOF Group] (Unit: millions of yen)
| Details of effects | Sum | ||
|---|---|---|---|
| (1) Profits | Business income from recycling of waste from main business or recycling of used products, etc. | 88 | |
| Other business income | 0 | ||
| (2) Costs saved | Reduction in energy cost by energy saving | 19 | |
| Reduction in waste disposal ensuing from material saving or recycling | 29 | ||
| Other reductions | 2 | ||
| Total*2 | 138 | ||
Changes from the past[Covered organizations:NOF Group]
| Category | Item | FY2020 | FY2021 | FY2022 | FY2023 | FY2024 |
|---|---|---|---|---|---|---|
| Environmental expenses*3 | Investment (million yen) |
1,203 | 1,300 | 1,140 | 952 | 1,227 |
| Expenses (million yen) |
3,136 | 3,155 | 3,448 | 3,135 | 3,459 | |
| Environmental conservation results from resources used in business activities | Total energy input (thousand GJ) |
3,247 | 3,377 | 3,112 | 2,909 | 2,903 |
| Total substance input (thousand tons) |
231 | 261 | 236 | 248 | 224 | |
| Water resource input (thousand ㎥) |
8,319 | 8,420 | 8,498 | 8,358 | 7,886 | |
| Environmental conservation results from environmental impact and waste materials generated from business activities | Greenhouse gas emissions (thousand tons of CO₂) |
195 | 198 | 185 | 169 | 151 |
| Production activities: Energy-related |
167 | 172 | 149 | 143 | 137 | |
| Production activities: Other |
20 | 18 | 27 | 17 | 14 | |
| Transportation-related | 8 | 9 | 10 | 10 | 8 | |
| Emissions of PRTR Act-controlled substances (tons) |
147 | 155 | 143 | 167 | 135 | |
| Plant emission volumes (tons) |
28,955 | 29,164 | 25,157 | 22,541 | 24,298 | |
| Final disposal of waste by landfill (tons) |
1,588 | 950 | 1,095 | 617 | 1,058 | |
| Wastewater volume (thousand ㎥) |
6,552 | 6,642 | 6,421 | 6,090 | 6,004 | |
| COD emissions (tons) |
219 | 154 | 148 | 171 | 153 | |
| NOx emissions (tons) |
57 | 55 | 55 | 58 | 46 | |
| SOx emissions (tons) |
4 | 5 | 7 | 8 | 5 |
- Environmental Accounting is a framework for quantitatively measuring and communicating the costs of environmental conservation activities in business activities and the effect gained by those activities by the monetary unit or material quantity. The purpose of this is to efficiently and effectively promote initiatives for environmental conservation while maintaining a good relationship with society.
- The total may not match the sum of the individual values due to rounding.
- Environmental conservation expenses:FY2020 to FY2022 (covers the domestic NOF Group),
FY2023 to FY2024 (covers the NOF Group, including two major overseas affiliates)